You launch a new campaign. You see likes, shares, and comments rolling in. But at the end of the quarter, revenue hasn't budged. Sound familiar?
Marketing today costs more, moves faster, and offers less room for error than ever before. Customer acquisition costs keep rising. Privacy regulations limit your data. And competition in almost every industry has reached a fever pitch.
CEOs, founders, CMOs, and brand managers can no longer afford to spend blindly. Every dollar needs a purpose. Every campaign needs a measurable outcome.
This is where Marketing KPIs (Key Performance Indicators) become essential. The right KPIs remove guesswork from your decisions. They reveal exactly what works, what wastes money, and where your biggest growth opportunities hide.
The best part? You don't need to track one hundred metrics. You just need the right ones at the right stages of your customer journey.
This guide walks you through a complete, full-funnel marketing KPI framework. You will learn exactly what to measure, why each metric matters, and how to turn data into smarter business decisions.
Ready to stop guessing and start growing?
Explore Vastcope's Data-Driven SEO Services to build a measurement foundation that drives real results.
Why Marketing KPIs Matter More Than Ever
Marketing has changed dramatically in the last few years. If results feel harder to achieve, there are clear reasons behind it.
Key forces reshaping modern marketing:
-
Customer acquisition costs are rising across almost every channel
-
Privacy regulations (like GDPR and iOS updates) limit tracking and targeting
-
Competition has intensified in every industry
-
Consumers now expect personalized, seamless, value-driven experiences
This means businesses can no longer afford to spend based on gut feelings. The old spray-and-pray approach wastes money and hides problems until it's too late.
The right marketing KPIs help you:
-
Understand which campaigns actually work and which drain your budget
-
Identify exactly where your funnel breaks (awareness, engagement, or conversion)
-
Make smarter budget allocation decisions based on data
-
Improve return on investment across every channel
-
Increase customer retention and lifetime value
-
Grow more predictably, not randomly
A study by McKinsey & Company confirms that data-driven organizations are 23 times more likely to acquire customers and six times more likely to retain them.
When you track the right metrics, marketing transforms from a cost center into a predictable growth engine.
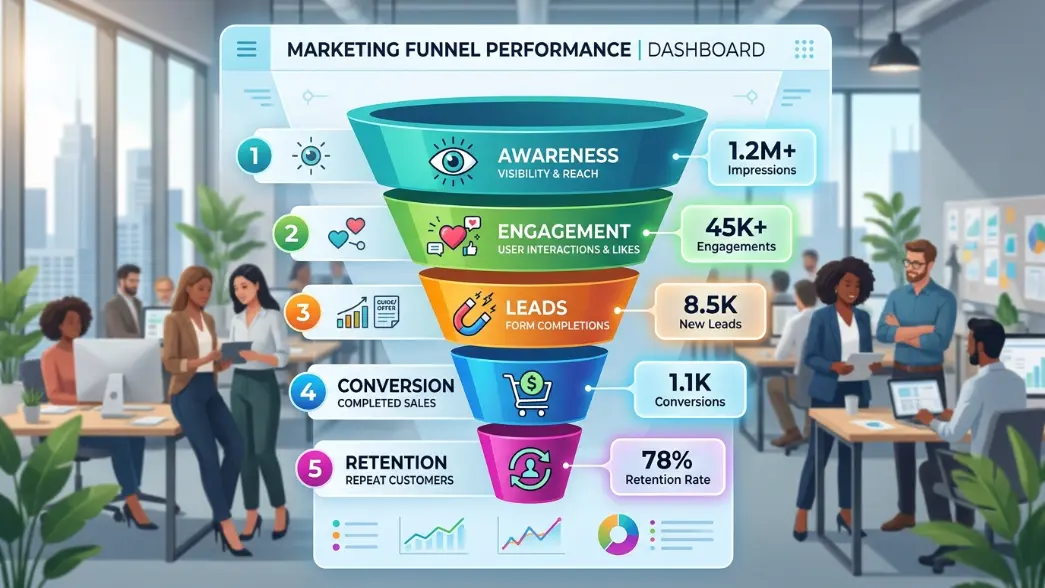
The Full-Funnel Marketing KPI Framework
To make KPI tracking actionable, we divide metrics into six logical stages. Each stage answers a specific question about your marketing performance.
The six stages of marketing KPIs:
-
Awareness KPIs – How many people see your brand?
-
Engagement KPIs – Are they interested enough to interact?
-
Video KPIs – Is your storytelling capturing attention?
-
Lead KPIs – Are you generating qualified prospects?
-
Conversion KPIs – Is your marketing actually profitable?
-
Retention KPIs – Do customers stay, repeat, and refer?
By breaking KPIs into these stages, you can clearly see where your funnel performs well and where it needs urgent attention. Fix the weakest stage first, and the rest of your funnel improves automatically.
Awareness KPIs – Measure Brand Visibility & Reach
Awareness KPIs tell you how many people you are reaching and how efficiently you buy attention. Think of this stage as the moment someone first notices your brand exists.
Without awareness, nothing else follows. No engagement, no leads, no sales.
Key awareness KPIs to track:
Reach
Reach tells you how many unique people saw your content.
-
Low reach → your targeting is too narrow or your campaigns lack sufficient budget
-
High reach but low engagement → you are reaching the wrong audience
Impressions
Impressions show how many times your content was displayed (including multiple views by the same person).
-
Low impressions → insufficient budget or low ad relevance scores
-
High impressions with low clicks → your creative or message does not connect
Frequency
Frequency shows how often the same person sees your ad.
-
Below 2 → people forget your brand before they act
-
Above 5–7 → ad fatigue sets in, annoyance grows, and performance drops
CPM (Cost per 1,000 Impressions)
CPM measures how efficiently you buy awareness.
-
High CPM → you are targeting a very competitive audience or your creative quality is low
-
Low CPM with poor downstream metrics → cheap reach is not the same as quality reach
Why awareness KPIs matter for decision makers:
Because everything that follows—engagement, leads, conversions—starts here. Awareness KPIs reveal whether:
-
Your budget is sufficient for your goals
-
Your target audience matches your ideal customer profile
-
Your message actually gets seen
-
Your creatives break through the noise
According to HubSpot's marketing statistics, 63% of marketers say generating traffic and leads is their biggest challenge, making awareness tracking more critical than ever.
Engagement KPIs – Measure How Interested Users Really Are
Awareness means people saw your content. Engagement means they actually care. This stage tells you how effective your content, website, and brand experience really are.
If people see you but don't engage, you have a relevance problem.
Key engagement KPIs to track:
Average Session Duration
This shows how long visitors stay on your website.
-
Very short sessions → poor user experience, irrelevant content, or mismatched expectations from your ads
Website Engagement Rate
Shows how actively visitors interact with your site (scrolling, clicking, hovering).
-
Low engagement rate → visitors aren't finding what they expected; your content isn't resonating
Exit Rate on Key Pages
Shows the percentage of visitors who leave your website from specific pages. High exit rates on critical pages like:
-
Pricing page
-
Product page
-
Landing page
-
Checkout page
…signals friction in the user journey. Each of these exits directly lowers potential revenue.
Organic & Paid Engagement Rates
These metrics show how effectively your content captures attention across different channels.
-
Low organic engagement → weak connection with your community or irrelevant content
-
Low paid engagement → poorly targeted audience or weak creative that fails to stop the scroll
Why engagement KPIs matter:
Interest always precedes action. If people aren't engaging, they definitely won't convert. Engagement KPIs help leaders identify:
-
Weak messaging that fails to resonate
-
Poor content strategy that doesn't serve the audience
-
Ineffective website UX that confuses or frustrates visitors
-
Targeting mismatches between your ads and the people who see them
Ready to improve how users interact with your site?
Discover Vastcope's UI/UX Design Services to create seamless, engaging digital experiences.
Video Marketing KPIs – Measure Attention & Storytelling Power
Video dominates modern marketing. But views alone tell you almost nothing about whether your videos actually work.
Video KPIs help you understand whether people stop, watch, and stay engaged with your storytelling. Big brands use video strategically to build emotional connections. You should too.
Key video KPIs to track:
Hook Rate (First 3 Seconds)
Measures how many people continue watching after the first few seconds.
-
Low hook rate → your opening fails to grab attention
-
High hook rate → your creative and opening message work
Hold Rate (Completion Rate)
Shows how many viewers finish your entire video.
-
Low hold rate → video is too long, boring, or unclear in its purpose
-
High hold rate → strong storytelling that keeps people watching
Average Watch Time
Tells how much of your video people actually watch. This is a more accurate indicator of true engagement than total views.
-
Low watch time → viewers drop off early; content isn't delivering value quickly enough
View-Through Rate (VTR)
Measures how many ad impressions turn into actual video views.
-
Low VTR → your content isn't compelling enough to make people stop scrolling and watch
Cost Per View (CPV)
Indicates how much you pay each time someone views your ad.
-
High CPV → low ad relevance or weak creative that doesn't earn attention
-
Low CPV with high engagement → strong performance worth scaling
Why video KPIs matter:
Video KPIs reveal whether your content earns attention or gets ignored. If your videos cannot hold attention, they will never drive leads, conversions, or long-term brand impact.
For deeper insights into video performance benchmarks, review this analysis from Wistia's Video Statistics.
Lead KPIs – Measure Your Ability to Capture Demand
At this stage, attention turns into action. Lead KPIs show whether your marketing does more than attract interest. They tell you if people actually take the next step and become potential customers.
Key lead KPIs to track:
Click-Through Rate (CTR)
Measures how often people click on your ads or emails after seeing them.
-
Low CTR → weak creative, poor targeting, or an unappealing offer
Cost Per Click (CPC)
Shows how cost-efficiently you generate clicks to your site or landing page.
-
High CPC → competitive audience, low ad relevance, or a poor quality score
Lead Conversion Rate
Indicates how effectively your landing page turns visitors into leads.
-
Low conversion rate → weak CTAs, too many form fields, or unclear value messaging
Cost Per Lead (CPL)
The amount you spend to acquire a single lead. Always compare CPL against Lead Value or Customer Lifetime Value (CLV).
-
CPL higher than CLV → your lead generation model is unsustainable
Qualified Lead Percentage
Measures how many of your leads actually fit your ideal customer profile.
-
Low qualified lead percentage → poor targeting, weak messaging, or you are attracting the wrong audience entirely
Lead-to-Customer Conversion Rate
Shows how effectively you turn qualified leads into paying customers.
-
Low conversion rate → weak nurturing sequences, long sales cycles, or poor sales follow-up processes
Why lead quality matters more than lead quantity:
Lead KPIs keep you focused on quality, not just volume. One thousand unqualified leads waste your sales team's time. Twenty qualified leads can transform your business.
When these numbers improve, your pipeline becomes more predictable. Marketing efforts finally translate into real revenue.
Conversion KPIs – Measure Revenue, Profit & ROI
Traffic, clicks, and leads only matter if they turn into revenue. Conversion KPIs connect marketing performance directly to business outcomes.
These metrics show whether your funnels, offers, and campaigns truly work.
Key conversion KPIs to track:
Conversion Rate
The percentage of visitors who complete a desired action (purchase, form submission, or sign-up).
-
Low conversion rate → friction exists in the journey: unclear messaging, weak offer, slow pages, or too many steps
Cost Per Acquisition (CPA)
Shows how much you spend to acquire each new customer.
-
High CPA → unprofitable marketing, especially when CPA exceeds Customer Lifetime Value (CLV)
Return on Ad Spend (ROAS)
How much revenue you generate for every dollar spent on ads.
-
ROAS below 1 → you are losing money on every sale
-
ROAS between 2 and 3 → acceptable performance for many industries
-
ROAS above 4 → strong performance ready for scaling
Return on Investment (ROI)
The overall profitability of your marketing efforts: how much you earn compared to what you spend.
-
Low or negative ROI → unprofitable campaigns or inefficient spend allocation across channels
How conversion KPIs drive profitability:
Conversion KPIs help you decide exactly what to scale, what to fix, and what to stop immediately. When these numbers stay healthy, marketing becomes a growth engine instead of a cost center.
For a deeper understanding of ROAS benchmarks across industries, refer to WordStream's advertising benchmarks.
Need to turn more visitors into paying customers?
Partner with Vastcope for Lead Generation to build high-converting funnels that drive real revenue.
Retention KPIs – Measure Loyalty, LTV & Business Sustainability
Retention is the most overlooked part of marketing. But it is also the most profitable.
Research from Bain & Company shows that a 5% increase in customer retention can increase profits by 25% to 95%. Existing customers already trust you. They cost less to sell to. And they buy more over time.
Key retention KPIs to track:
Customer Retention Rate
Indicates how effectively you keep customers coming back over a specific period.
-
Low retention → poor customer experience, weak product value, or lack of ongoing engagement
Customer Churn Rate
Shows the percentage of customers you lose over a given period. This is the inverse of retention.
-
High churn → poor product experience, unmet expectations, or weak ongoing value delivery
Customer Lifetime Value (CLV)
Tells how much revenue a customer brings over their entire relationship with your business.
-
Low CLV → weak retention, low purchase frequency, or poor customer experience
-
CLV determines how much you can afford to pay to acquire each customer
Net Promoter Score (NPS)
Measures how likely customers are to recommend your brand to others.
-
Low NPS → high churn risk; customers are unhappy but silent
-
High NPS → referral potential and strong brand trust working in your favor
Upsell / Cross-Sell Rate
Shows how effectively you increase revenue from existing customers by getting them to buy more or choose higher-value products.
-
Low rate → weak product positioning, unclear value pathways, or lack of personalized recommendations
Why retention KPIs matter for long-term growth:
Acquiring a new customer costs five to seven times more than retaining an existing one. Retention KPIs help you build a sustainable, compounding business instead of constantly refilling a leaky bucket.
How Decision Makers Should Use This KPI Framework
Having KPIs is not the goal. Using them correctly is what transforms businesses.
The real value comes from how you apply this framework to daily decisions, budget planning, and growth strategy. When used well, KPIs remove emotion and guesswork from marketing conversations.
Here is how CEOs, founders, and marketing leaders use KPIs strategically:
1. Identify where your funnel breaks
Instead of trying to fix everything at once, look for the weakest stage first. Ask yourself which stage consistently underperforms.
-
Awareness stage → low reach or low impressions
-
Engagement stage → low clicks, views, or site interactions
-
Lead stage → low sign-ups or poor lead quality
-
Conversion stage → visitors browse but do not buy
-
Retention stage → customers leave and never return
2. Prioritize fixes based on revenue impact
Focus your efforts where they will drive the most growth. Fix the largest leaks first. Address the stages causing the most significant revenue loss before optimizing minor issues.
3. Use KPIs to guide budget decisions
Marketing spend should follow results, not assumptions.
-
Reduce or stop spending on channels that consistently underperform your benchmarks
-
Increase investment where KPIs show profitable returns
-
Test new channels carefully, then scale only what proves it works
KPIs give you the confidence to reallocate budgets without guesswork or internal politics.
4. Align KPIs with your current business goals
Choose metrics that reflect what the business is trying to achieve right now.
-
Launching a new product → focus on awareness and engagement metrics
-
Scaling paid ads → prioritize ROAS, CPA, and conversion metrics
-
Entering a new market → track reach, impressions, and brand lift
-
Retaining more customers → monitor retention rate, churn, and CLV
-
Improving profitability → focus on ROI, CAC vs. CLV, and efficiency metrics
Frequently Asked Questions (FAQ)
1. How many marketing KPIs should a business track regularly?
Track no more than 8 to 12 KPIs total across your entire funnel. Focus on one to three metrics per stage (awareness, engagement, leads, conversion, retention). Tracking too many metrics creates confusion instead of clarity.
2. What is the most important marketing KPI for a new business?
For new businesses, focus on Customer Acquisition Cost (CAC) and Customer Lifetime Value (LTV). You need to know whether you acquire customers profitably and whether they stay long enough to make that investment worthwhile.
3. How often should leadership review marketing KPIs?
Review high-level KPIs (ROAS, CPA, conversion rate) weekly for active campaigns. Review strategic KPIs (CLV, retention rate, market share) monthly or quarterly. Daily metric checking creates noise, not better decisions.
4. Why is retention rate more important than conversion rate for mature businesses?
Because increasing customer retention by just 5% can boost profits by 25% to 95%. Mature businesses already have an audience. Keeping existing customers costs far less than acquiring new ones and generates more predictable revenue.
5. What is a good ROAS benchmark for most industries?
A ROAS of 3:1 (three dollars in revenue for every dollar spent) is considered acceptable for many ecommerce and SaaS businesses. A ROAS of 4:1 or higher is strong. Anything below 2:1 typically indicates unprofitable campaigns, though benchmarks vary by industry and margins.
6. Can a campaign have great engagement but terrible conversion rates?
Yes, this is common. High engagement with low conversion rates usually indicates a mismatch between your content and your offer. People enjoy the content (video views, likes, comments) but see no compelling reason to buy. Fix the offer or the value proposition, not the content.
7. How do privacy changes affect marketing KPI tracking?
Privacy regulations and browser changes (like iOS updates) have made tracking harder, especially for attribution. Focus less on last-click attribution and more on multi-touch attribution, incrementality testing, and first-party data collection through your own website and CRM.
8. What is the difference between a marketing KPI and a vanity metric?
A KPI directly ties to a business outcome (revenue, profit, retention, or customer growth). A vanity metric looks impressive but does not predict future success. Page views are often vanity metrics. Qualified leads and conversion rates are true KPIs.
Conclusion
Modern marketing no longer runs on guesswork. It runs on clarity, data, and informed decisions.
The KPIs covered in this guide help you understand what actually works, where your performance breaks down, and where your biggest growth opportunities hide. They give you the visibility needed to allocate budgets wisely, fix funnel leaks, and scale what delivers real results.
But remember: KPIs only create value when they lead to action. Reviewing the numbers is not enough. Acting on them is what drives sustainable growth.
You now have a complete framework. Use it to remove emotion from your marketing decisions. Use it to hold your team accountable. And use it to transform your marketing from a cost center into a predictable, profitable growth engine for your entire business.
Ready to build a marketing measurement system that actually works?
Partner with Vastcope for Full-Service Digital Growth and turn your KPIs into actionable strategies that drive revenue.