How Much Do Facebook Ads Cost in 2026? Full Pricing Breakdown
Facebook advertising in 2026 remains the undisputed king of ROI for brands of all sizes. But ask ten marketers how much you should spend, and you will get ten different answers. The truth is that there is no fixed price tag. Instead, your costs depend on an auction system where competition, creative quality, and audience behavior all play a role.
This guide cuts through the noise with hard data. You will learn exactly what you can expect to pay for clicks, impressions, and leads in 2026. More importantly, you will discover proven strategies to lower those costs and maximize your return on ad spend.
Need expert eyes on your campaign data? Our Facebook Ads management services help businesses cut wasted spend and scale profitably—schedule a free audit today.
The Short Answer: What Advertisers Pay in 2026
If you need a quick number, here it is. Most businesses pay between $0.50 and $3.00 per click on Facebook in 2026. However, this range varies significantly based on your industry, targeting choices, and ad quality.
Platform-wide averages across all industries tell a clearer story. According to recent benchmark data compiled from millions of ad impressions, here is what 2026 looks like:
| Metric | Average Cost | Typical Range |
|---|---|---|
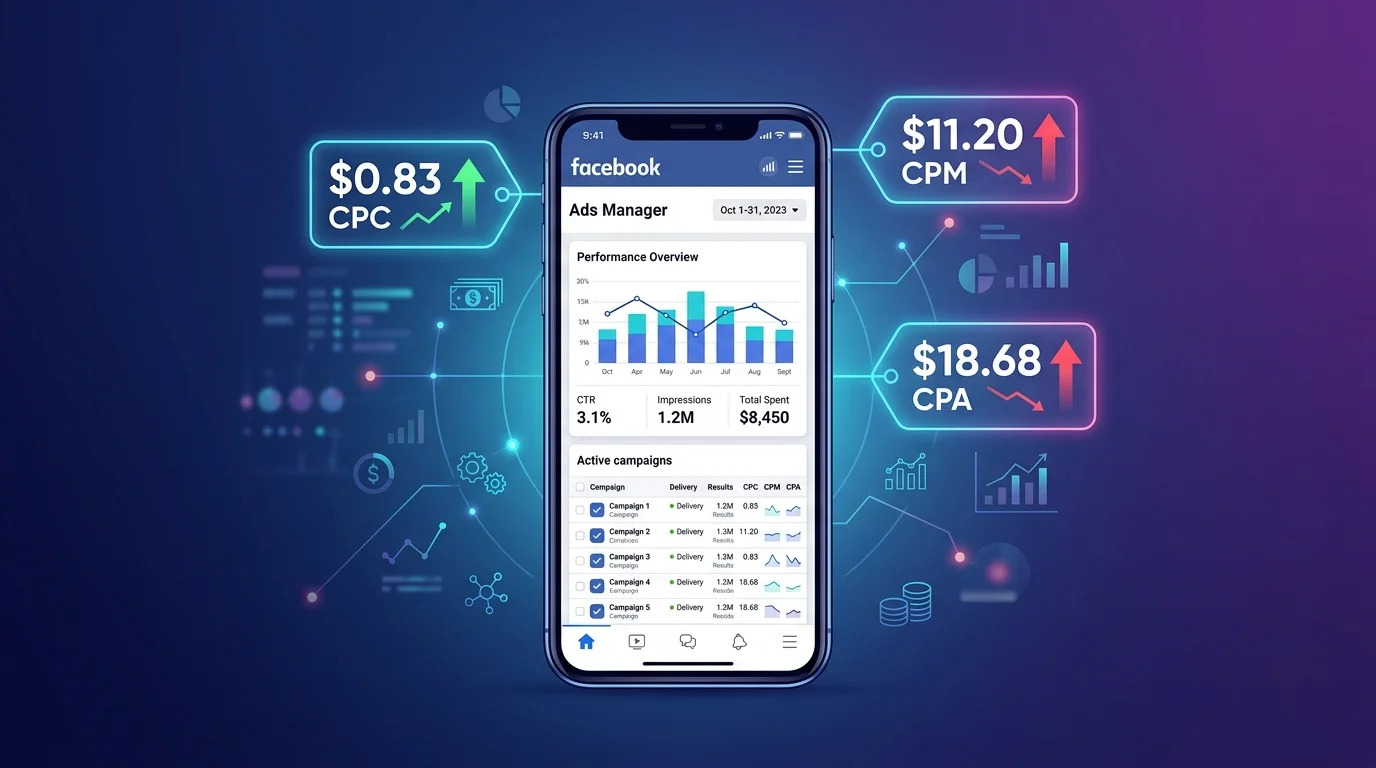
| Cost Per Click (CPC) | $0.83 | $0.50 – $3.00 |
| Cost Per 1,000 Impressions (CPM) | $11.20 | $5.00 – $28.00 |
| Cost Per Lead (CPL) | $27.66 | $10.00 – $50.00+ |
| Cost Per Action (CPA) | $18.68 | $7.85 – $55.21 |
These figures represent global averages across all industries and campaign types. Your actual costs will differ, but these benchmarks provide a reliable starting point for budget planning. For a deeper dive into regional variations, Databox’s 2026 Facebook ad benchmark study offers industry-specific breakdowns.
Breaking Down the Core Metrics You Need to Track
Understanding each pricing metric helps you choose the right optimization strategy. Let us break down what each one means and when you should use it.
Cost Per Click (CPC): Paying for Engagement
CPC measures the amount you pay each time a user clicks your ad. This metric works best for traffic and conversion campaigns where you want users to take immediate action.
The median CPC across industries sits at $0.57, but the platform-wide average lands around $0.83. E-commerce brands often see lower CPCs around $0.75, while finance and insurance companies frequently pay over $1.85 per click.
When CPC matters most:
-
Driving targeted traffic to landing pages
-
Testing new ad creative for engagement
-
Running product catalog sales campaigns
Cost Per Mille (CPM): Paying for Reach
CPM represents the cost for 1,000 ad impressions. This metric works best for brand awareness campaigns where you simply want eyeballs on your message.
In the United States, CPMs remain significantly higher than global averages. U.S. advertisers pay an annual average of $22.20 per 1,000 impressions, which is roughly 12% more than the global figure. This premium reflects the higher purchasing power of American audiences.
When CPM matters most:
-
Launching new products to broad audiences
-
Running video view campaigns
-
Building brand recognition in new markets
Cost Per Lead (CPL) and Cost Per Action (CPA): Paying for Results
For performance-focused advertisers, CPL and CPA provide the clearest picture of efficiency. Lead generation campaigns average $27.66 per lead, while purchase-driven campaigns typically fall between $35 and $55 per acquisition.
Here is the critical insight. A lower CPL does not always mean better results. A $45 Facebook lead that converts at 4% costs $1,125 per customer, while a $150 Google lead that converts at 12% costs $1,250 per customer. The difference is marginal, but Facebook gives you higher volume with more variance.
Want leads that actually close? Our lead generation services focus on quality, not just quantity—turn your Facebook traffic into paying customers.
Industry Benchmarks: What Different Sectors Pay
Your industry heavily influences your Facebook ad costs. Here is how different sectors compare in 2026.
Low-Cost Industries
Some industries enjoy remarkably low advertising costs due to broad appeal and lower competition.
| Industry | Avg CPC | Avg CPM |
|---|---|---|
| Food & Beverage | $0.42 | $2.82 |
| Retail | $0.70 | $1.38 |
| E-commerce | $0.45 | $5.33 |
| Apparel | $0.45 | $5.99 |
| Gaming | $0.57 | $8.90 |
Food & Beverage brands benefit from some of the lowest acquisition costs, averaging just $20.47 per customer. These industries typically target broad audiences, which keeps CPMs low.
Medium-Cost Industries
Most businesses fall into the medium-cost range, where competition drives prices higher but remains manageable.
| Industry | Avg CPC | Avg CPM | Avg CPA |
|---|---|---|---|
| Education | $0.68 | $9.20 | $11.50 |
| Health & Wellness | $0.92 | $11.70 | $16.80 |
| Real Estate | $1.40 | $14.30 | $28.90 |
| SaaS / Technology | $1.25 | $15.80 | $22.50 |
Education campaigns often achieve the lowest CPA among medium-cost industries, while real estate and SaaS face higher costs due to the value of each lead.
High-Cost Industries
Highly competitive sectors pay a premium for access to valuable audiences.
| Industry | Avg CPC | Avg CPM | Avg CPA |
|---|---|---|---|
| Finance / Fintech | $1.85 | $18.50 | $35.60 |
| Insurance | $1.22+ | $29.16+ | Varies |
| Legal Services | $3.00+ | $45.00+ | $72.40+ |
| B2B SaaS | $1.25 | $42.17 | $63.40 |
Finance ads cost around $18.50 per 1,000 impressions, while legal services can exceed $45.00. Food & Beverage ads can be as low as $2.82. The gap between the cheapest and most expensive verticals can exceed 3x on a CPA basis.
What Factors Drive Your Facebook Ad Costs?
Facebook does not use a fixed price list. Your costs depend on several dynamic factors that you can control to some extent.
1. Your Campaign Objective
Different objectives come with dramatically different price tags. Here is what the data shows:
| Campaign Objective | Avg CPC | Avg CPM | Avg CPA |
|---|---|---|---|
| Brand Awareness | $0.35 | $7.50 | N/A |
| Traffic | $0.72 | $9.80 | $1.20 |
| Engagement | $0.18 | $5.40 | $0.65 |
| Leads | $1.05 | $13.50 | $12.80 |
| Conversions | $1.15 | $14.60 | $18.40 |
Conversion campaigns cost the most per action, but they deliver the most valuable results. Choosing the wrong objective for your funnel stage dramatically impacts cost efficiency.
2. Audience Size and Specificity
Narrow audiences typically cost more to reach because you compete with other advertisers for the same limited pool of users. Broad targeting generally delivers lower CPCs but may bring less qualified traffic.
In 2026, Meta's Advantage+ audience tools carry most of the targeting load. Advertisers who use broad targeting with strong creative see lower costs than those clinging to narrow interest-based audiences.
3. Ad Quality and Relevance
Facebook rewards engaging content. The platform rates your creative based on user feedback and predicted action rates. High-quality ads cost less to run because Facebook wants to show users content they will actually like.
An advertiser bidding $2 with terrible creative will lose to someone bidding $1 with amazing creative. Quality literally beats quantity in the Facebook auction.
4. Seasonality and Timing
Costs spike predictably during high-demand periods. Q4 CPMs average about 15-20% higher than Q3 due to holiday competition. The cheapest time to advertise is January through February, when CPMs drop to their lowest point.
5. Geographic Location
Where your audience lives dramatically impacts your costs. English-speaking, high-income markets attract the most advertiser competition.
| Country | Avg CPM | Avg CPC |
|---|---|---|
| United States | $20.48 | $1.24 |
| Canada | $14.03 | $0.92 |
| Australia | $11.04 | $1.01 |
| United Kingdom | $10.85 | $1.17 |
| India | $2.70 | $0.17 |
Targeting audiences in emerging markets like India offers dramatically lower costs, but you sacrifice purchasing power per user.
Struggling with high CPCs? Our SEO services complement your paid strategy by driving organic traffic that converts—lower your customer acquisition costs today.
How 2026 Algorithm Changes Impact Your Costs
Facebook's advertising algorithm has undergone fundamental changes that directly affect what you pay. Understanding these shifts helps you adapt your strategy before your competitors do.
The Andromeda Algorithm Revolution
In late 2024, Meta introduced a completely new algorithm called Andromeda, effectively replacing the old targeting systems advertisers relied on for years. Previously, advertisers controlled targeting by manually selecting audiences based on interests or behaviors. Andromeda flips this dynamic completely.
Now, Meta controls the targeting, using your ad creative to determine who should see your content. This algorithm learns at an exponential rate. During beta testing, the Andromeda update delivered a 5% increase in ad conversions on Instagram. By Q3, that efficiency improvement had doubled.
What this means for your costs: Broad targeting now often outperforms manual interest-based targeting. To execute this correctly, you must be radically broad—targeting entire countries with no age, gender, or interest restrictions gives the AI maximum data to find your ideal customer.
The Meta Lattice Update
Meta recently rolled out a major update to Meta Lattice that changes how ads are learned and delivered across its platforms. This update collapses ad delivery across Facebook, Instagram, Stories, Reels, and other surfaces into a single learning system. Optimization no longer happens placement by placement. It happens everywhere, all at once.
The reported gains are impressive: roughly 10% lifts in revenue-driving metrics, +6% conversion rate improvements, and 20% capacity savings at the platform level. The brands that win on Meta in 2026 will not out-optimize the algorithm but out-inform it.
Advantage+ Campaigns
Meta's Advantage+ Shopping Campaigns deliver 22% higher ROAS compared to manual campaign setups. This AI-driven automation reshapes ad strategies, with automated campaigns achieving an average ROAS of 4.52x, compared to 3.70x for manual campaigns.
Facebook vs. Instagram: Where Should You Advertise?
Both platforms operate under Meta's unified ad system, but costs and performance differ significantly.
Facebook Advertising Costs
Facebook remains one of the most cost-effective advertising platforms available. Current benchmarks show an average CPC of $0.83 and average CPM of $11.20. The platform excels at reaching broad audiences and offers strong geographic targeting capabilities.
Best for: Local campaigns, product ads, retargeting, and lead generation.
Instagram Advertising Costs
Instagram commands higher prices due to its engaged, visual-first audience. The average CPC runs roughly 1.5x Facebook's at $1.31, while average CPM reaches $15.26. According to WordStream’s 2026 social media cost report, these premiums often pay off for lifestyle brands.
Instagram placement costs vary significantly:
-
Feed CPC: $3.35
-
Stories CPC: $1.83
-
Reels CPM: $6-$15
Best for: Fashion, beauty, and lifestyle brands, product launches, visual storytelling, and influencer partnerships.
Making the Right Choice
Your goal should determine your platform choice. Facebook works better for B2B lead generation with its lower CPL and professional audience segments. Instagram excels at brand building with higher engagement rates and visual appeal. For e-commerce, many successful brands use Facebook for traffic and Instagram for discovery.
How to Lower Your Facebook Ad Costs Without Hurting Results
Rising costs do not have to kill your profitability. Here are proven strategies to reduce your ad spend while maintaining or improving performance.
1. Stop Constantly Tweaking Your Campaigns
Constantly tweaking targeting or swapping creatives in Ads Manager does not improve performance. It actually disrupts performance by resetting the learning phase and killing campaign momentum.
Focus on steering, not rebuilding. Adjusting a budget by 10% or tweaking a manual bid cap guides the car while it is moving. Changing targeting or pausing a main creative tears the engine apart while driving at 100 mph.
2. Embrace Broad Targeting
Because Andromeda's machine learning is now so advanced, broad targeting often outperforms manual interest-based targeting. Target the entire country with no age selection, no gender selection, and no interests. This gives the AI the maximum amount of data to find your ideal customer.
3. Prioritize Creative Quality
Strong creative can overcome targeting challenges and reduce costs. Facebook rewards engaging content with lower delivery costs through its relevance scoring system. High-quality video content is now essential—Reels alone account for over 40% of Meta ad impressions. Meta’s Creative Best Practices guide offers actionable tips.
4. Use Advantage+ Campaigns
Switch to Advantage+ Shopping Campaigns. They outperform manual setups by 22% on average, delivering better results at lower costs.
5. Run Retargeting Campaigns
Retargeting campaigns consistently outperform prospecting campaigns because they reach people already familiar with your brand. The median ROAS for Facebook retargeting is 3.61x, significantly higher than the 2.19x overall average.
6. Time Your Campaigns Strategically
If you are budget-constrained, consider running awareness campaigns in Q1 when CPMs are at their lowest. Avoid launching expensive conversion campaigns during November and December unless your margins can absorb the holiday premium.
Ready to scale without breaking the bank? Our web development team builds high-converting landing pages that maximize your ad spend ROI.
Realistic Budgets for Different Business Types
How much should you actually spend? Here are realistic monthly ad budgets based on business size and goals.
Small Businesses and Startups
Most small businesses spend between $500 and $5,000 per month on Facebook Ads. They focus on localized reach and brand awareness. However, campaigns under $1,000 per month often struggle to generate meaningful optimization data.
Recommended starting budget: $10 to $50 per day to see meaningful results. Smaller budgets limit your reach and testing ability.
Growing Businesses
Medium-sized enterprises typically allocate $5,000 to $25,000 per month on Facebook Ads, investing heavily in lead generation and conversion optimization. These budgets allow for proper creative testing and audience scaling.
Enterprise Brands
Large national and global brands spend $25,000 to $200,000+ per month on Meta advertising. These budgets include dedicated account teams, advanced Advantage+ campaign optimization, and multi-market coordination.
Understanding Return on Ad Spend (ROAS)
Costs only tell half the story. You also need to know what you get back.
The 2026 average Facebook ads ROAS across all industries is 2.19:1, meaning every dollar spent returns $2.19 in tracked revenue. However, this average varies dramatically by industry and campaign type. For a current industry-wide perspective, Statista’s Facebook ROAS data confirms these trends.
Best-performing industries for ROAS:
-
Baby Products: 3.71:1
-
Finance & Insurance: 3.50:1
-
SaaS: 4x-7x
-
E-commerce: 3x-4x
Facebook retargeting campaigns achieve a median ROAS of 3.61x, significantly outperforming the 2.19x overall average.
A 3.5:1 ROAS is considered a solid cross-industry benchmark. If you are hitting 4x or higher, your campaigns are performing exceptionally well.
Need creative that actually converts? Our UI/UX design team creates ad visuals and landing pages that drive engagement and lower your CPCs.
2026 Trends That Will Shape Your Costs
Several forces are pushing Facebook ad costs in specific directions. Understanding these trends helps you anticipate where prices are headed.
CPMs Are Rising
The average Meta Ads CPM has climbed to $13.48, marking a 20.03% increase from 2025. This rise highlights Meta's shift toward being seen as a "premium" advertising channel.
CPCs Are Stabilizing
Meta's Advantage+ campaigns and improved AI targeting have reversed the CPC inflation trend. The average Facebook CPC has actually decreased slightly year-over-year for traffic campaigns, dropping 6.67%.
Location-Based Fees Are Coming
From July 1, 2026, Meta will begin applying location-based fees to ads delivered in certain countries to cover Digital Services Taxes (DST) and other regulatory costs. This change will increase costs for advertisers targeting specific international markets.
Video Dominates the Feed
Reels now account for over 40% of Meta ad impressions. Brands without video content risk higher ad costs and reduced engagement.
Frequently Asked Questions About Facebook Ads Cost
1. What is the minimum daily budget for Facebook Ads in 2026?
Meta sets your minimum daily budget at just $1. Technically, you can start advertising for the price of a coffee. However, most businesses spend $10 to $50 per day to see meaningful results. Smaller budgets limit your reach and testing ability.
2. Why do Facebook ad costs vary so much between businesses?
Facebook uses an auction system where your costs depend on multiple factors: your industry's competitiveness, your target audience's value, your ad quality score, the time of year, and your campaign objective. A poorly targeted ad costs more than a laser-focused one. Better creative lowers your costs. Higher engagement does too.
3. Are Facebook Ads cheaper than Google Ads?
Yes, Facebook Ads are significantly cheaper on a per-click and per-lead basis. Facebook's average CPC of $0.83 is far lower than Google's average of $5.26. Facebook's average CPL of $27.66 is 60% cheaper than Google's $70.11. However, Google leads typically convert at higher rates because they come from active search intent.
4. What is a good ROAS for Facebook Ads in 2026?
A good ROAS depends on your industry and margins. The cross-industry average is 2.19:1, meaning every dollar returns $2.19. A 3.5:1 ROAS is considered solid, and anything above 4:1 indicates exceptional performance. High-margin businesses can still be profitable with lower ROAS figures.
5. How do algorithm changes affect my costs in 2026?
Meta's Andromeda algorithm has shifted targeting control from manual selection to AI-driven delivery. Broad targeting now often outperforms narrow interest targeting. Advertisers who feed the algorithm strong creative and clear conversion signals see lower costs, while those using outdated manual tactics pay more.
6. What is the cheapest time to run Facebook Ads?
The cheapest time to advertise on Facebook is January through February. CPMs drop to their lowest point after the holiday season, with January 2026 seeing CPMs as low as $17.12 in the U.S. compared to November peaks of $28.09.
7. Do Instagram Ads cost more than Facebook Ads?
Yes, Instagram Ads typically cost more. Instagram's average CPC of $1.31 is roughly 1.5x Facebook's $0.83, and its average CPM of $15.26 exceeds Facebook's $11.20. However, Instagram often delivers higher engagement rates, which can justify the premium for visually oriented brands.
8. How much should a small business spend on Facebook Ads monthly?
Small businesses typically spend between $500 and $5,000 per month on Facebook Ads. However, campaigns under $1,000 per month often struggle to generate meaningful optimization data. A realistic starting point is $10 to $50 per day, which allows for proper testing and learning.
Ready to master your Facebook ad strategy? Explore our video editing services for ad creatives to produce high-performing video ads that lower your CPC and boost conversions.
Conclusion: Making Facebook Ads Work for Your Budget
Facebook advertising in 2026 offers unmatched reach and targeting capabilities, but success requires more than just setting a budget and hoping for the best. The platform's costs continue to rise, yet the ROI potential remains strong for businesses that adapt to the new AI-driven landscape.
The key takeaways are simple. Stop obsessing over daily tweaks and let the algorithm learn. Prioritize creative quality over manual targeting precision. Use Advantage+ campaigns to leverage Meta's AI. Time your campaigns strategically to avoid premium pricing periods. And always measure ROAS, not just raw costs.
Most importantly, remember that Facebook's average costs are just benchmarks. Your actual results will depend entirely on how well you execute. A business spending $500 per month with amazing creative and smart targeting will often outperform a competitor spending $5,000 with generic ads and outdated tactics.
The brands that win on Meta in 2026 will not out-optimize the algorithm. They will out-inform it. Feed the system strong signals, great creativity, and clear conversion data. Then step back and let the machine do what it does best.