

Data without a narrative serves no purpose. When you export raw numbers from Google Analytics or Search Console, you only provide a snapshot of isolated metrics. A true SEO report translates those numbers into a compelling business story, proving the value of your marketing efforts and guiding future strategic decisions.
Modern search landscapes move incredibly fast. Marketers no longer just track ten blue links on a Google results page. You now must account for AI Overviews, zero-click searches, generative engine optimization, and complex multi-channel attribution. Stakeholders demand clarity. They want to know exactly how organic search impacts the bottom line.
Discover how our comprehensive digital services can transform your raw data into measurable business growth today.
This guide breaks down exactly how to build high-impact SEO reports. We cover the core key performance indicators (KPIs), advanced analytics frameworks, and the exact steps you need to take to communicate organic growth effectively.
The Evolution of SEO Reporting

Ten years ago, SEO reporting looked incredibly simple. You tracked keyword rankings, counted backlinks, and measured overall website traffic. If the graph went up, the client or executive team stayed happy.
Today, this simplistic approach guarantees failure. Search engine algorithms utilize advanced machine learning to process natural language, measure user experience, and prioritize semantic relevance. Google Analytics 4 (GA4) replaced Universal Analytics, shifting the focus from simple pageviews to event-based user engagement. Furthermore, AI-powered answer engines require entirely new measurement frameworks.
To survive this shift, your reporting must evolve. You must bridge the gap between technical search metrics and actual business revenue.
Understanding Your Audience: Tailoring the SEO Report
A major reporting mistake involves sending the exact same dashboard to every stakeholder. A Chief Marketing Officer (CMO) cares about entirely different metrics than an in-house content writer. Before you pull a single data point, you must define your audience.
The Executive Report (C-Suite and Founders)
Executives care about money, market share, and risk. They do not want to see core web vitals scores or keyword density metrics. They want a high-level summary that answers three questions:
- How much revenue did organic search generate this month?
- What is our return on investment (ROI) for the SEO budget?
- Are we beating our primary competitors?
Keep executive reports under two pages. Focus on lead generation, customer acquisition cost (CAC), and pipeline value.
Ready to upgrade your analytics strategy? Contact our expert team to build custom tracking solutions for your business.
The Marketing Manager Report
Marketing directors and managers need a bridge between high-level strategy and tactical execution. They want to see how SEO impacts other channels. Your report should highlight:
- Year-over-year (YoY) and Month-over-month (MoM) traffic trends.
- Top-performing landing pages.
- Conversion rates by organic landing page.
- Content gaps and upcoming strategic recommendations.
The Specialist Report (Developers and Writers)
Technical teams and content creators need granular data. Writers need to know exactly what SEO keywords are driving the most qualified traffic so they can optimize future articles. Developers need specific performance diagnostics. Include:
- Crawl errors and indexation status.
- Page speed metrics (LCP, INP, CLS).
- Individual keyword ranking fluctuations.
- On-page engagement metrics (scroll depth, time on page).
Setting Up Your Analytics Foundation
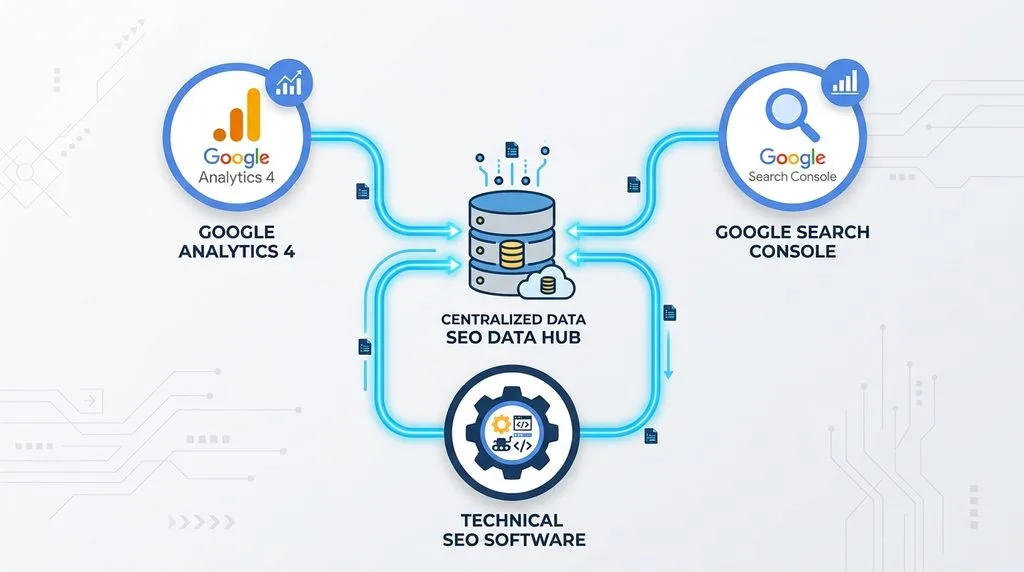
You cannot build a reliable report on flawed data. Before you select your KPIs, ensure your tracking architecture captures information accurately. You need three primary tools to build a comprehensive SEO analytics stack.
1. Google Analytics 4 (GA4)
GA4 serves as the central hub for measuring user behavior and business impact. Ensure you properly configure your conversion events. Do not rely on default settings. Set up custom events for form submissions, newsletter sign-ups, whitepaper downloads, and e-commerce purchases. Connect GA4 directly to your Google Search Console account to view query data alongside engagement metrics.
2. Google Search Console (GSC)
Search Console provides the most accurate data regarding how Google actually views your website. It acts as your diagnostic hub. GSC reveals your exact click-through rates (CTR), impressions, average positions, and technical indexation issues.
3. Third-Party SEO Software
While Google provides excellent free tools, you need third-party software like Ahrefs, Semrush, or Moz to track competitor data, estimate search volumes, and monitor backlink profiles. These tools fill the gaps left by Google’s privacy filters.
Essential SEO KPIs to Track
Key Performance Indicators dictate the success or failure of your campaign. However, tracking too many metrics creates noise. Focus on the core KPIs that actually indicate business growth.
1. Organic Traffic (Users and Sessions)
Organic traffic represents the foundational metric of any SEO campaign. Track both “Total Users” and “Sessions” originating from search engines. Always compare current traffic to the previous period (MoM) and the previous year (YoY) to account for seasonal trends.
2. Organic Conversions and Revenue
Traffic means nothing if visitors do not buy your product or contact your team. Measure the exact number of leads, sign-ups, or sales generated from organic search. In GA4, navigate to your acquisition reports and filter by the “Organic Search” channel group to isolate this data. Calculate the conversion rate by dividing organic conversions by organic sessions.
3. Keyword Rankings and Share of Voice
While tracking individual keyword rankings holds less weight today due to personalized search results, you still need to monitor your overall visibility. Track your target terms, but pay closer attention to your “Share of Voice.” Share of Voice measures your total visibility across a specific set of topics compared to your competitors.
4. Click-Through Rate (CTR)
Impressions mean nothing if users scroll past your link. Your GSC report highlights your average CTR across all queries. If you notice a page ranking well (positions 1-3) but experiencing a low CTR, you immediately know you need to rewrite your title tag and meta description to improve clickability.
Build absolute domain authority and trust by leveraging our specialized SEO backlink strategies for sustainable organic growth.
5. Engagement Rate
GA4 replaced the outdated “Bounce Rate” with a more positive metric: Engagement Rate. An engaged session lasts longer than 10 seconds, triggers a conversion event, or includes at least two pageviews. A low organic engagement rate signals a mismatch between the search intent and your actual page content.
Advanced and Technical SEO Metrics
Once you master the basics, you must track technical indicators. These metrics act as leading indicators. If your technical metrics crash, your traffic and revenue will soon follow. Implementing advanced SEO techniques requires strict performance tracking to ensure search engines can properly crawl and render your site.
Core Web Vitals
Google considers page experience a ranking factor. Track your Core Web Vitals through GSC and PageSpeed Insights.
- Largest Contentful Paint (LCP): Measures loading performance. Aim for under 2.5 seconds.
- Interaction to Next Paint (INP): Measures visual stability and responsiveness. Aim for under 200 milliseconds.
- Cumulative Layout Shift (CLS): Measures visual stability. Aim for a score below 0.1.
Crawlability and Indexation Status
A page cannot rank if Google cannot index it. Monitor your GSC “Pages” report. Look for spikes in 404 errors, 500 server errors, or pages tagged as “Crawled – currently not indexed.” These errors block search engines from accessing your content.
Optimize your technical infrastructure from the ground up with our professional CMS development services tailored for search visibility.
Backlink Velocity and Health
Links remain a powerful ranking signal. Track your backlink velocity the rate at which you acquire new inbound links. Monitor your referring domains. Look out for sudden drops in referring domains, which may indicate a lost link, or massive spikes in toxic links, which could indicate a negative SEO attack.
Reporting on Generative Engine Optimization (GEO)
Traditional search engines are morphing into answer engines. Platforms like ChatGPT, Perplexity, and Google’s AI Overviews provide direct answers to user queries without requiring a click. Tracking performance in these environments requires a new reporting methodology.
Read our complete guide on what GEO is to understand how large language models process and cite your content.
Tracking Brand Mentions in AI Outputs
You cannot use standard analytics tools to track AI overview impressions. Instead, you must track brand visibility within AI models. Use brand monitoring tools and manual prompt testing to see if LLMs recommend your brand for industry-specific queries. Track the sentiment and accuracy of these AI-generated responses.
Measuring Zero-Click Value
As AI overviews dominate search results, organic clicks will naturally decrease for top-of-funnel queries. Your report must adapt. Start tracking “brand search volume” as an indicator of top-of-funnel success. If your educational content appears in AI overviews, users will recognize your brand and search for you directly later. Integrating CRO and GEO strategies helps maximize conversions from the remaining high-intent traffic that actually clicks through to your site.
A Step-by-Step SEO Reporting Framework
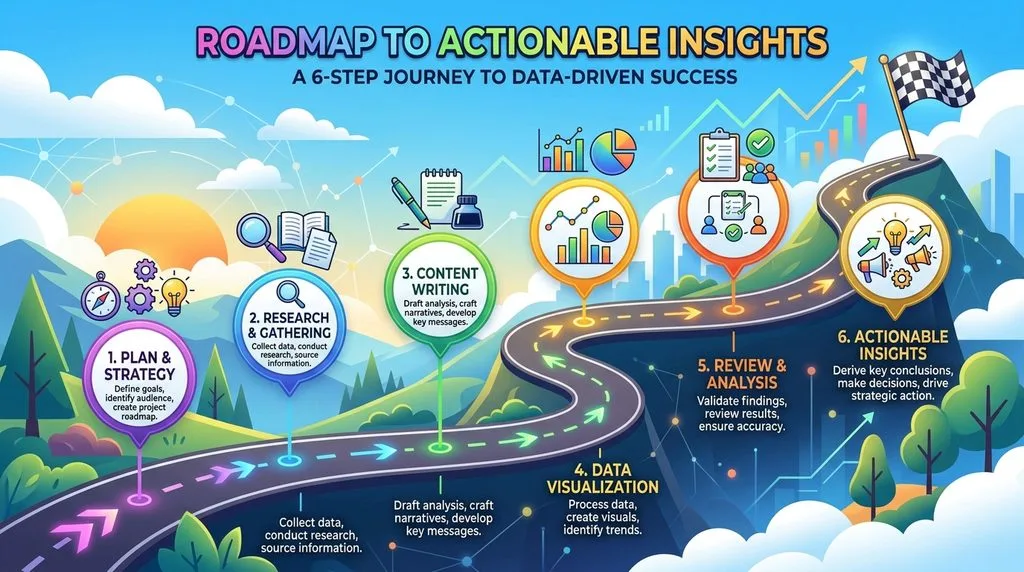
Follow this structured framework to build a monthly SEO report that clients and executives will actually read and understand.
Step 1: Define the Objective
Never start a report with data. Start with the goal. Did the client want to increase lead generation by 15% this quarter? Did the executive team want to rank higher for a specific product category? State this objective clearly at the very top of the document.
Step 2: Write the Executive Summary
Place an executive summary on the first page. Write this section last, but position it first. Summarize the entire month’s performance in three to four bullet points.
- Highlight the biggest win (e.g., “Organic revenue increased by 12% MoM”).
- Address the biggest challenge (e.g., “Algorithm update caused a temporary dip in blog traffic”).
- State the immediate next step (e.g., “We are updating historic content to recover lost traffic”).
Step 3: Present High-Level Traffic and Revenue Metrics
Show the big picture. Display a clean line chart showing organic sessions and conversions over the last 12 months. This visual provides immediate context. Follow the chart with a simple table detailing YoY and MoM percentage changes.
Step 4: Break Down Keyword and Page Performance
Identify the specific pages and queries driving the high-level metrics. List the top 10 highest-converting landing pages. Highlight pages that experienced massive traffic drops so the team knows where to focus their troubleshooting efforts.
Step 5: Detail Technical Health and Content Production
Provide a brief update on the infrastructure. List any technical fixes completed during the month, such as optimizing images or fixing broken internal links. Provide a log of the new content published during the reporting period.
Step 6: Provide Actionable Recommendations (The “So What?”)
Data holds no value without insight. Conclude every report with strategic recommendations. If you show that organic traffic dropped by 10%, you must immediately explain why it dropped and what you plan to do about it next month. Actionable insights transform a reporting document into a strategic roadmap.
Data Visualization Best Practices for SEO
How you present your data matters just as much as the data itself. Poor formatting confuses stakeholders and hides important insights. Follow strict data visualization rules when building dashboards in tools like Looker Studio or Tableau.
Choose the Right Chart for the Right Data
Do not use pie charts to show organic traffic over time. Use specific visualizations for specific purposes:
- Line Charts: Use these to show trends over time (e.g., traffic over 12 months).
- Bar Charts: Use these to compare categories (e.g., traffic by device type or traffic by country).
- Scorecards: Use these to display single, high-impact numbers (e.g., Total Organic Revenue).
- Tables: Use these to list granular data (e.g., top 10 landing pages and their respective conversion rates).
Avoid “Data Vomit”
Do not cram 50 different metrics onto a single dashboard page. White space improves readability. Group your metrics logically. Create one page dedicated to traffic, a separate page for conversions, and a final page for technical health. Keep colors consistent use green for positive changes and red for negative trends.
Tying SEO Performance to Business Revenue (ROI)

The ultimate goal of any SEO report is proving Return on Investment. You must demonstrate that the money spent on SEO software, content creation, and agency fees generated a positive financial return.
Calculating SEO ROI
Use a simple formula to calculate SEO ROI: (Organic Revenue – Cost of SEO Campaign) / Cost of SEO Campaign x 100 If an e-commerce store generates $50,000 in organic sales in a month, and the SEO campaign costs $5,000, the ROI is 900%.
Lead Generation Attribution
For B2B companies, calculating revenue proves more difficult due to long sales cycles. You must assign a monetary value to your leads. If you know that 10% of your organic leads eventually close, and the average customer lifetime value (CLV) is $10,000, you can assign a value of $1,000 to every organic lead generated. Configure this value in GA4 to populate your reports with estimated revenue.
Common SEO Reporting Mistakes to Avoid
Even experienced marketers fall into reporting traps. Avoid these common pitfalls to maintain trust with your stakeholders.
1. Hiding Bad News
Organic search fluctuates constantly. Algorithm updates, server outages, and aggressive competitors will occasionally cause your traffic to drop. Never manipulate date ranges or cherry-pick metrics to hide a traffic loss. Acknowledge the drop immediately, explain the root cause, and present a recovery plan. Transparency builds long-term trust.
2. Focusing on Vanity Metrics
Ranking #1 for a keyword with zero search volume or commercial intent looks great on a slide deck but drives zero revenue. Stop reporting on vanity metrics. Shift the conversation away from raw keyword rankings and toward qualified traffic and conversions.
3. Delivering the Report Without Context
Never email a PDF report without offering an explanation. A dashboard cannot explain nuance. Always schedule a brief meeting to walk stakeholders through the data, or record a quick five-minute screen-share video explaining the insights.
Automating Your SEO Reporting Workflow
Manually exporting CSV files from five different tools wastes hours of valuable time. Automate your reporting process to free up resources for actual strategy and execution.
Leveraging Looker Studio
Google’s Looker Studio (formerly Data Studio) serves as the industry standard for SEO automation. You can connect Looker Studio directly to GA4 and GSC using native connectors. Once you build the dashboard, the data updates in real-time. You can schedule Looker Studio to email a PDF snapshot to your clients on the first day of every month automatically.
Stop guessing with your marketing budget and reach out to us today to implement data-driven SEO strategies.
Utilizing APIs and Custom Scripts
For enterprise-level reporting, standard connectors may fail to handle massive datasets. Developers use APIs (Application Programming Interfaces) to extract data from tools like Ahrefs or Screaming Frog and pipe it directly into data warehouses like Google BigQuery. Python scripts can then clean and organize this data before feeding it into advanced visualization software.
The Future of Search Analytics
SEO reporting will continue to evolve rapidly. As search engines rely more on AI to answer queries directly, standard click-through rates will decrease for informational searches.
Future reporting frameworks will focus heavily on brand authority, sentiment analysis, and share of model recommendations. You will need to track how often AI agents cite your content as a trusted source. You must stay adaptable. Build flexible dashboards, focus strictly on revenue-driving metrics, and always prioritize clear communication over raw data dumps.
Frequently Asked Questions (FAQs)
How often should I send an SEO report to my clients?
Send comprehensive performance reports on a monthly basis. Weekly reports often cause panic due to natural, day-to-day algorithm fluctuations. Monthly reporting provides a large enough data sample to identify genuine trends and actionable insights.
Why does Google Analytics data look different from Google Search Console data?
GA4 tracks user behavior based on browser cookies and scripts after a user lands on your site. Search Console tracks activity directly on the Google search results page before the click. Differences in timezone settings, ad blockers, and cookie consent banners cause natural discrepancies between the two platforms.
What is a good organic conversion rate?
A “good” conversion rate depends entirely on your industry and the specific action you track. E-commerce sites generally see organic conversion rates between 1.5% and 3%. B2B lead generation sites often see conversion rates between 2% and 5%. Always benchmark against your own historical data rather than industry averages.
How do I track SEO performance if my website does not sell products online?
If you run a service-based or B2B business, track macro and micro-conversions. Set up GA4 events to track form submissions, phone call clicks, email clicks, and PDF downloads. Assign a calculated monetary value to these actions based on your historical close rates.
Can I track keywords strictly using Google Search Console?
Yes, GSC provides accurate average position data for the queries driving traffic to your site. However, GSC only shows data for queries where you generated an impression. To track target keywords where you currently rank poorly (e.g., page 5 and beyond), you must use a third-party rank tracker.
How do I explain a massive drop in organic traffic to an executive?
First, isolate the variable. Determine if the drop stems from a technical error, a seasonal trend, a competitor outranking you, or a broad Google core algorithm update. Present the exact cause to the executive, explain the business impact, and immediately outline your step-by-step strategy to recover the lost visibility.
What is the difference between a session and a user in GA4?
A “User” represents an individual person (or device browser) visiting your website. A “Session” represents a single visit. One user can generate multiple sessions if they visit your website, leave, and return the next day.
Does my SEO report need to include competitor data?
Yes, incorporating competitor data provides crucial context. If your traffic drops by 5%, but your primary competitor drops by 20% due to an algorithm update, your relative performance actually improved. Use tools like Semrush or Ahrefs to include Share of Voice comparisons in your quarterly reviews.
Keep reading
All articles
How to Find and Choose the Right Keywords for SEO (A Complete GEO & SEO Guide)
Mastering search visibility requires more than just guessing what your target audience types into a search bar. You must engineer a precise,…
Read article
How to Use Web Marketing: The Ultimate Beginner’s Guide
Learn the definition of web marketing and see how to leverage digital channels like email, search, and social media to reach more…
Read article
Mobile SEO Best Practices for Higher Rankings & Better User Experience
Smartphone screens generate over 60% of all global web traffic. Desktop search experience no longer dictates digital visibility. Google enforces mobile-first indexing…
Read article