
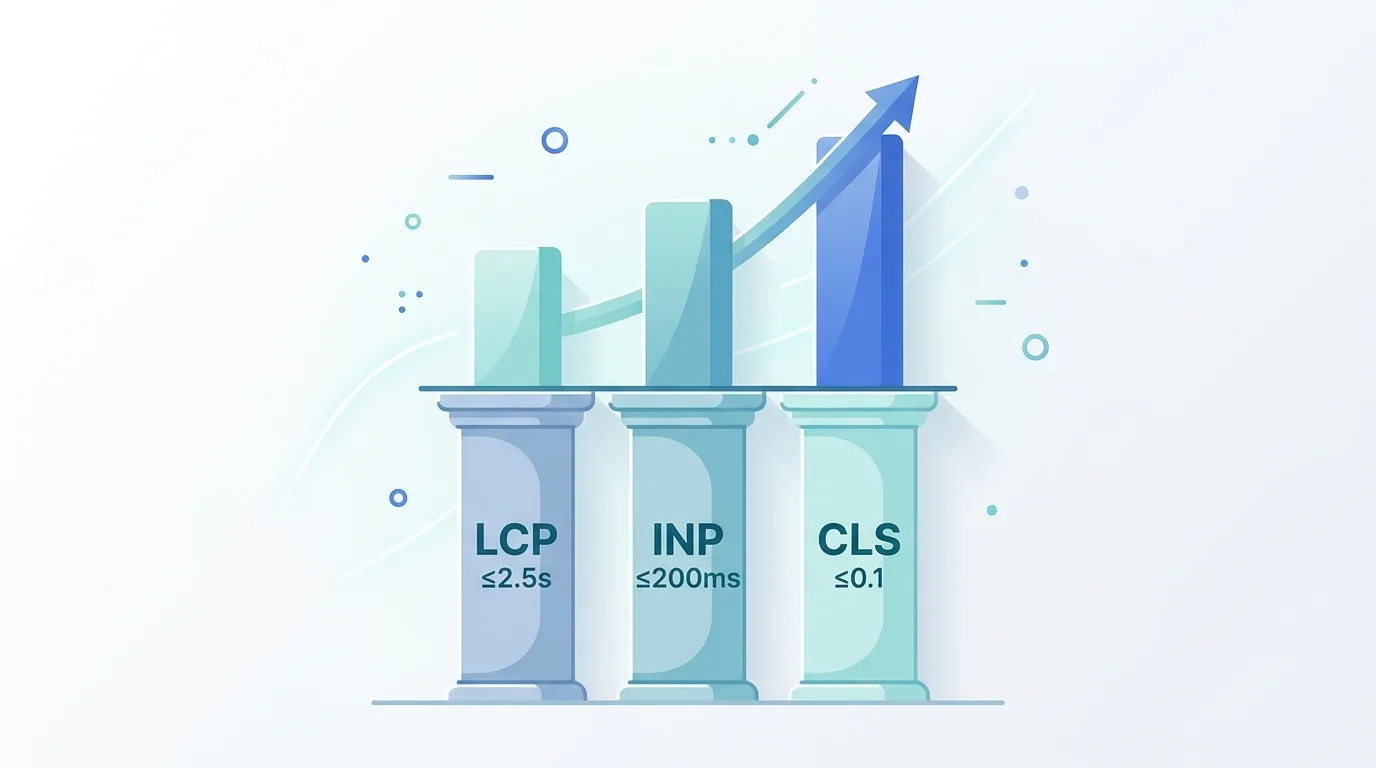
The digital landscape is ruthless when it comes to performance. Users expect websites to load instantaneously, respond to taps without hesitation, and display content without visually jarring shifts. To quantify this user experience, Google introduced Core Web Vitals a unified set of quality signals vital to delivering a superior web experience. But with the rapid evolution of search algorithms and the rise of AI-powered answer engines, many digital marketers and developers are asking a critical question: Do these metrics still hold the same weight today?
The short answer is an unequivocal yes. Core Web Vitals are no longer just a trend or a passing algorithm update; they are the baseline foundation of modern web architecture. As search engines become more sophisticated at evaluating user satisfaction, technical performance is intrinsically linked to your organic visibility and baseline conversion rates.
Ready to achieve blazing-fast load times? Partner with our experts in [suspicious link removed] to elevate your site’s performance today.
Understanding the mechanics behind these metrics is no longer optional for businesses that want to thrive online. This comprehensive guide will break down the current state of Core Web Vitals, how to optimize for the latest updates, and why investing in web performance remains one of the most profitable technical decisions a company can make.
The Evolution of Page Experience Metrics
To truly understand the importance of Core Web Vitals, we must first look at how Google’s approach to measuring page speed has evolved over the past decade. In the early days of SEO, “page speed” was a monolithic metric. Tools would measure how long it took for the entire page load event to fire. However, this provided a highly inaccurate representation of what the user was actually experiencing. A page might take ten seconds to fully load in the background, but if the primary text and images appeared within two seconds, the user perceived the site as fast.
Recognizing this discrepancy, Google began shifting toward user-centric performance metrics. They introduced metrics like First Contentful Paint (FCP), which measured when the first piece of DOM content rendered, and Speed Index, which evaluated how quickly the visual contents of a page populated. While these were vast improvements, they still lacked a standardized, definitive way to measure the holistic user experience across different devices and network conditions.
This culminated in the creation of Core Web Vitals. Google wanted a simplified, standardized trio of metrics that represented the three most critical facets of user experience: loading performance, interactivity, and visual stability. By anchoring these metrics to real-world user data through the Chrome User Experience Report (CrUX), Google ensured that websites were being judged based on how actual humans experienced them, rather than how a bot crawled them in a controlled laboratory environment.
Want a technical partner who understands digital growth? Learn more about our agency and our elite web standards.
The Big Three: Breaking Down the Core Web Vitals
The current Core Web Vitals framework consists of three distinct pillars. Each metric addresses a specific element of the user journey, from the moment they click a link to the moment they finish interacting with the page. To succeed in modern SEO, you must pass the assessment for all three.
For a broader overview of how these metrics fit into the wider ecosystem of web development, there are numerous comprehensive breakdowns of Core Web Vitals available, but below we will dive into the deep technical mechanics of each one.
1. Largest Contentful Paint (LCP): Mastering Loading Performance
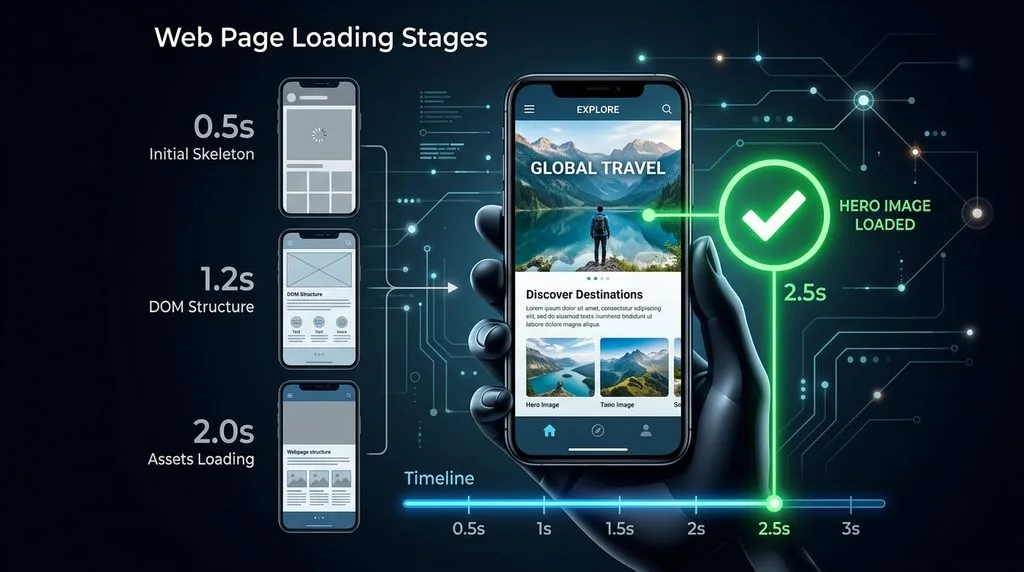
Largest Contentful Paint (LCP) measures perceived load speed. Specifically, it marks the exact point in the page load timeline when the main, most prominent piece of content has likely loaded on the screen. This could be a hero image, a featured video thumbnail, or a large block of heading text.
Understanding LCP Thresholds
To provide a good user experience, Google requires that sites achieve an LCP of 2.5 seconds or less for at least 75% of all page visits.
- Good: Under 2.5 seconds
- Needs Improvement: Between 2.5 and 4.0 seconds
- Poor: Over 4.0 seconds
The Four Sub-Parts of LCP
Achieving a fast LCP is often the most challenging aspect of Core Web Vitals because it relies heavily on your underlying server architecture and resource routing. LCP is not a single delay; it is the sum of four distinct sub-parts:
- Time to First Byte (TTFB): This is the time it takes for a user’s browser to connect to your server and receive the very first byte of data. Slow TTFB is usually caused by poor server performance, lack of caching, or complex backend database queries.
- Resource Load Delay: This is the gap between receiving the initial HTML document and the browser actually beginning to download the LCP asset (like the hero image). If your hero image is hidden deep within a CSS file or requires JavaScript to render, the browser won’t know it needs to download it until much later in the process.
- Resource Load Time: This is the sheer time it takes to transfer the LCP asset over the network. Large, uncompressed images or heavy font files will severely inflate this duration.
- Element Render Delay: Once the asset is fully downloaded, this is the time it takes for the browser to paint it onto the screen. Heavy main-thread blocking JavaScript can cause the browser to freeze, delaying the render even if the file is already downloaded.
How to Optimize LCP
Fixing LCP requires a methodical approach to how your website delivers assets. The most effective strategy is to ensure your LCP element is discoverable in the initial HTML payload.
- Implement Preloading: If your LCP element is a hero image, use a
<link rel="preload">tag in your document head. This tells the browser to start fetching the image immediately, rather than waiting to parse the entire DOM. - Utilize Fetch Priority: Modern browsers support the
fetchpriority="high"attribute on image tags. This signals to the browser’s download manager that this specific asset should jump to the front of the queue. - Optimize Server Response Times: Utilize a high-quality Content Delivery Network (CDN) to serve assets from edge servers located physically closer to your users. Implement aggressive server-side caching for HTML documents.
- Compress and Serve Modern Image Formats: Never serve heavy PNGs or JPEGs for hero elements. Convert images to WebP or AVIF formats, which provide superior quality at a fraction of the file size. Ensure images are properly sized for mobile devices so the browser doesn’t waste time downloading desktop-sized hero banners on a 4G mobile connection.
2. Interaction to Next Paint (INP): The Era of Responsiveness

In March 2024, Interaction to Next Paint (INP) officially replaced First Input Delay (FID) as the core metric for interactivity. This was a massive paradigm shift. FID only measured the input delay of the very first interaction a user had with a page, and it ignored the actual time it took to process the event and render the visual update. Because of these limitations, almost 99% of websites passed FID, making it an obsolete metric.
INP solves this by observing the latency of all click, tap, and keyboard interactions that occur throughout the entire lifespan of a user’s visit to a page. It then reports the single longest interaction (ignoring outliers) as the final INP score.
Understanding INP Thresholds
INP demands incredibly fast processing to ensure the page feels snappy and responsive.
- Good: Under 200 milliseconds
- Needs Improvement: Between 200 and 500 milliseconds
- Poor: Over 500 milliseconds
The Anatomy of an INP Delay
When a user clicks an accordion menu, adds an item to their cart, or types in a search bar, that interaction is broken down into three phases:
- Input Delay: The time between the user physically tapping the screen and the browser’s event handler catching the action. If the browser’s main thread is currently busy executing a massive third-party tracking script, the input event sits in a queue, causing high input delay.
- Processing Time: The time it takes for your custom JavaScript event handlers to run. If you have inefficient code that loops through thousands of DOM elements upon a button click, processing time will spike.
- Presentation Delay: The time it takes for the browser to recalculate the layout, apply CSS styles, and paint the new pixels to the screen.
How to Optimize INP
Optimizing INP is fundamentally about managing JavaScript execution and keeping the browser’s main thread free from congestion. The main thread can only do one thing at a time. If it is parsing a giant JavaScript bundle, it cannot respond to user clicks.
- Yield to the Main Thread: Break up long JavaScript tasks into smaller chunks. Tasks that take longer than 50 milliseconds block the main thread. By utilizing modern APIs like
scheduler.yield()orsetTimeout, you can pause execution, allow the browser to process any pending user interactions, and then resume the script. - Minimize DOM Size: An excessively large Document Object Model (DOM) forces the browser to work much harder during the presentation phase. When an interaction requires a visual update, the browser must traverse the DOM to calculate style and layout changes. Keep your DOM depth shallow and avoid rendering thousands of hidden elements.
- Audit Third-Party Scripts: Chat widgets, analytics trackers, and advertising scripts are notorious for hijacking the main thread. Defer non-critical third-party scripts until after the page has fully loaded and the user has begun interacting with it.
- Use Web Workers: For highly complex mathematical calculations or data processing that happens upon user interaction, offload that work to a Web Worker. Web Workers run on a separate background thread, meaning they will not block the main thread from painting visual updates to the screen.
3. Cumulative Layout Shift (CLS): Ensuring Visual Stability
Have you ever tried to tap a button on a mobile website, only for a massive advertisement to suddenly load at the top of the screen, pushing the button down and causing you to click a completely different link? That frustrating experience is exactly what Cumulative Layout Shift (CLS) aims to eliminate.
CLS measures the visual stability of a webpage. It calculates a score based on the amount of unexpected layout shifts that occur during the entire lifespan of the page. It looks at the size of the elements that shifted and the distance they moved across the viewport.
Understanding CLS Thresholds
Unlike LCP and INP, CLS is not measured in seconds or milliseconds. It is a mathematical score based on impact fractions and distance fractions.
- Good: Under 0.1
- Needs Improvement: Between 0.1 and 0.25
- Poor: Over 0.25
Common Causes of Layout Shifts
Layout shifts almost always occur because the browser doesn’t know how much space an element will take up until after the asset finishes downloading. When the asset finally arrives, the browser has to violently shove existing content out of the way to make room.
- Images Without Dimensions: In the early days of responsive web design, developers simply set images to
width: 100%; height: auto;. While this made images responsive, it meant the browser had zero idea how tall the image would be until it downloaded. This results in massive layout shifts. - Web Fonts Causing FOUT/FOIT: Flash of Unstyled Text (FOUT) occurs when a fallback system font loads first, and then suddenly swaps to a custom web font. Because different fonts have different letter spacing and x-heights, the text block will suddenly expand or contract, shifting the content below it.
- Dynamic Ads and Embeds: Third-party ad networks inject iframes of unpredictable sizes onto the page. If the container housing the ad doesn’t have a reserved minimum height, the page will violently jump when the ad finally renders.
How to Optimize CLS
CLS is generally the easiest of the three metrics to fix because the solutions are structural and CSS-based, rather than relying on deep server architecture.
- Always Declare Width and Height: Always include exact
widthandheightattributes on your<img>and<video>HTML tags. Modern browsers use these attributes to compute an aspect ratio before the image downloads, reserving the exact correct amount of space on the screen. Alternatively, utilize modern CSS properties likeaspect-ratio: 16/9;for dynamic containers. - Reserve Space for Ads: If you run programmatic advertising or inject dynamic promotional banners, statically reserve the space for them in your CSS using
min-height. If the ad fails to load, you will have a blank space, but your content will not shift violently. - Optimize Font Delivery: Use the CSS property
font-display: optionalorfont-display: swapin conjunction withsize-adjust. Thesize-adjustproperty allows you to modify the fallback system font so that it perfectly matches the dimensions of your custom web font, eliminating any shift when the font finishes loading. - Never Insert Content Above Existing Content: Unless it is in direct response to a user interaction (like clicking a “read more” accordion), never dynamically inject DOM elements above content that the user is currently reading.
Why Core Web Vitals Still Dictate SEO in 2026
As artificial intelligence begins to power search features like AI Overviews, some marketers have incorrectly assumed that technical performance metrics are taking a back seat to semantic relevance and content quality. This is a dangerous misconception. While content will always remain king, Core Web Vitals serve as the critical infrastructure that allows your content to be discovered, crawled, and ranked effectively.
To fully grasp how Google integrates these metrics into their ranking algorithms, reviewing Google’s official documentation on Core Web Vitals is highly recommended. However, we can break down the practical SEO impact into three main categories.
The Page Experience Ranking Factor
Core Web Vitals are officially baked into Google’s Page Experience ranking signal. While Google has clarified that Core Web Vitals are a “tie-breaker” signal rather than a primary topical relevance signal, the modern web is hyper-competitive. If you and a competitor have equally exceptional, comprehensive content on a specific topic, but your competitor’s site loads in 1.2 seconds with zero layout shifts, while your site takes 4.5 seconds and stutters upon scrolling, Google will rank the competitor higher. User experience is a direct proxy for content utility. If users cannot access your content quickly, the content is deemed less useful.
Crawl Budget and Rendering Efficiency
When search engine bots crawl your website, they do not have infinite resources. Crawl budget is the number of pages a bot will crawl on your site within a given timeframe. Slow server response times (which directly cause poor LCP) actively drain your crawl budget. If your server takes three seconds to respond to every request, Googlebot will simply crawl fewer pages before leaving. This means new blog posts, updated product pages, and critical site changes may go unindexed for weeks.
Furthermore, Google relies on a web rendering service to execute JavaScript and “see” your page as a user would. If your site suffers from heavy main-thread blocking JavaScript (which causes poor INP), it delays the rendering bot. Sites built with heavy client-side rendering frameworks that fail to optimize Web Vitals often struggle with severe indexing delays.
AI Search and Answer Engines
AI answer engines synthesize information from multiple sources to provide immediate answers. These AI agents favor websites with exceptionally clean code, fast time-to-first-byte, and highly structured data. A site that is bogged down by excessive DOM nodes, shifting layouts, and sluggish response times presents a hostile environment for automated data extraction. High Core Web Vital scores indicate a technically sound, well-maintained platform—traits that AI retrieval systems implicitly trust and prioritize when sourcing citations.
E-Commerce and Core Web Vitals: The Revenue Connection
Nowhere are Core Web Vitals more critical than in the e-commerce sector. The correlation between millisecond delays and lost revenue is not a myth; it is a proven statistical reality documented by virtually every major retail platform on the web.
When users are attempting to make a purchase, they have exceptionally low tolerance for friction. If an e-commerce platform suffers from poor LCP, users stare at a blank screen wondering if the site is broken, increasing bounce rates immediately. If the site suffers from poor INP, a user might tap “Add to Cart” and experience a half-second delay. During that delay, they might assume the tap didn’t register and tap it again, accidentally adding two items to the cart, leading to frustration and cart abandonment.
For businesses relying on digital sales, investing in modern e-commerce web development that prioritizes performance architecture is mandatory. E-commerce sites face unique challenges when optimizing Core Web Vitals due to the heavy reliance on high-resolution product imagery, complex filtering systems, third-party payment gateways, and dynamic inventory scripts.
Optimizing an e-commerce platform requires aggressive edge caching, implementing server-side rendering (SSR) or static site generation (SSG) for product catalogs, and ruthlessly eliminating third-party tracking bloat that interferes with the checkout flow. The return on investment for fixing Web Vitals in an e-commerce setting is almost immediate. Case studies repeatedly show that improving LCP by just one second can boost mobile conversion rates by up to 27%.
The Crucial Intersection of Security and Performance

A frequently overlooked factor in Core Web Vitals optimization is how your website’s security infrastructure impacts loading metrics. Maintaining a secure environment is non-negotiable, but poorly configured security protocols can devastate your TTFB and LCP scores.
When a user’s browser attempts to connect to your secure website, it must perform a DNS lookup, establish a TCP connection, and execute an SSL/TLS handshake. The TLS handshake is the process where the browser and server securely exchange cryptographic keys. If your server is running outdated security protocols or bloated certificates, this handshake can require multiple round trips over the network before a single byte of HTML is transmitted.
To mitigate these delays while maintaining ironclad security, businesses must stay updated on website security trends in 2026. Transitioning to modern protocols like TLS 1.3 is critical, as it reduces the handshake process to a single round trip, dramatically slashing the time required to establish a secure connection. Furthermore, implementing HTTP/3 leverages the QUIC protocol, which combines the TCP and TLS handshakes into one seamless action, providing a massive boost to LCP on high-latency mobile networks.
Additionally, Web Application Firewalls (WAFs) and DDoS protection services act as a middleman between the user and your server. While essential for protection, inefficient firewall rules can delay server response times. It is vital to routinely audit your security architecture to ensure it provides maximum protection with minimal latency. For a deeper understanding of this balance, exploring resources on optimizing SSL/TLS for web security can provide actionable insights for server administrators.
How to Measure, Monitor, and Maintain Web Vitals
Improving your Core Web Vitals is not a one-time project; it requires continuous monitoring and a shift in organizational culture to prioritize performance alongside feature development. To optimize effectively, you must understand the difference between Lab Data and Field Data.
Field Data vs. Lab Data
Field Data (also known as Real User Monitoring or RUM) is the actual performance data collected from real humans visiting your website. This data is aggregated by Google through the Chrome User Experience Report (CrUX). This is the only data that impacts your SEO rankings. However, CrUX data operates on a 28-day rolling average. This means if you fix a performance issue today, it will take up to 28 days for your official CrUX score to fully reflect the improvement.
Lab Data, on the other hand, is generated in a controlled, simulated environment. When you run a test in Lighthouse or PageSpeed Insights, a machine simulates loading your page on a specific device with a specific network speed. Lab data is essential for developers because it provides immediate feedback and actionable debugging diagnostics. However, lab data cannot perfectly predict field data, because it cannot simulate the exact devices and network conditions of your diverse user base.
Essential Measurement Tools
To build a robust performance monitoring strategy, utilize the following suite of tools:
- Google Search Console (GSC): GSC provides a dedicated Core Web Vitals report. This is your primary dashboard for understanding how Google views your entire domain. It groups URLs with similar technical issues, allowing you to identify template-wide problems rather than fixing pages one by one.
- PageSpeed Insights (PSI): This tool provides both the 28-day Field Data (if your site has enough traffic to be included in CrUX) and immediate Lab Data. It offers highly specific technical recommendations, such as which exact JavaScript files are blocking the main thread or which images need explicit dimensions.
- Chrome DevTools: For deep technical debugging, the Performance panel in Chrome DevTools is indispensable. Developers can record a page load and analyze a millisecond-by-millisecond flame chart of main thread activity, allowing them to pinpoint the exact functions causing high INP.
- Web Vitals Chrome Extension: This lightweight extension provides immediate, real-time feedback on LCP, INP, and CLS as you navigate through your own website or your competitors’ websites. It is incredibly useful for spotting layout shifts or interaction delays during everyday browsing.
Building a Performance Culture
Websites naturally degrade in performance over time. Marketing teams add new tracking pixels, content teams upload massive unoptimized hero images, and developers push new JavaScript features. To maintain healthy Core Web Vitals in the long term, organizations must integrate performance budgets into their development pipelines. A performance budget sets strict limits on the size of JavaScript bundles and image payloads. If a new feature pushes the page weight over the budget, the deployment is blocked until it is optimized. By catching performance regressions before they hit the live production environment, you protect your UX and your organic rankings.
Common Myths About Core Web Vitals
Despite being standard practice for years, several pervasive myths still surround Core Web Vitals optimization. Clearing up these misconceptions is vital for allocating resources efficiently.
Myth 1: A perfect 100/100 score guarantees top rankings. Reality: Core Web Vitals are a prerequisite for competitive ranking, not a magic bullet. If your content is irrelevant to the search query, no amount of speed will rank it at the top. The goal is to pass the “Good” threshold for all three metrics. Once you are in the green, obsessing over a perfect lab score yields diminishing SEO returns compared to improving content quality.
Myth 2: Desktop scores matter just as much as Mobile scores. Reality: Google utilizes mobile-first indexing. While desktop performance is important for desktop users, Google evaluates your site’s mobile performance to determine your baseline ranking. Because mobile devices generally have slower processors and rely on cellular networks, achieving passing mobile scores is significantly harder—and far more critical—than passing desktop scores.
Myth 3: You can fix Core Web Vitals with a simple plugin. Reality: While caching plugins can help improve TTFB and defer basic scripts, they cannot fix deep architectural flaws. A plugin cannot rewrite a bloated React application causing severe INP delays, nor can it redesign a CSS grid causing layout shifts. True Core Web Vitals optimization requires a fundamental understanding of frontend engineering and server architecture.
Conclusion
Core Web Vitals remain the definitive benchmark for delivering exceptional digital experiences. By mastering LCP, INP, and CLS, you ensure that your website respects your users’ time, provides a frictionless interactive environment, and maintains rock-solid visual stability. In an era where AI integrations and fierce competition dominate search engines, technical excellence is the ultimate differentiator.
Optimizing these metrics requires technical precision, but the rewards higher search rankings, lower bounce rates, and increased conversions—are well worth the investment. Don’t let slow load times and sluggish interactions sabotage your digital growth.
Frequently Asked Questions (FAQs)
1. How long does it take to see Core Web Vitals improvements in Google Search Console?
Because Google Search Console relies on the Chrome User Experience Report (CrUX), it uses a 28-day rolling average based on real user data. Once you implement a fix on your website, it will take up to 28 days for the old, slow data to completely cycle out and for your dashboard to fully reflect the new, optimized scores.
2. Why did Interaction to Next Paint (INP) replace First Input Delay (FID)?
FID was deemed insufficient because it only measured the delay of the very first click on a page, and it only measured the delay before processing started—ignoring the actual processing and visual rendering time. INP is a much stricter, more comprehensive metric that tracks all interactions throughout the entire visit and measures the full lifecycle of the interaction from click to visual update.
3. Will failing Core Web Vitals cause my website to be penalized?
Google does not issue manual “penalties” for poor Core Web Vitals. However, failing these metrics means you lose out on the Page Experience ranking boost. In highly competitive search results, this lack of a boost acts as a functional demotion, allowing faster competitors with similar content quality to outrank you.
4. How does third-party code like Google Tag Manager affect my scores?
Third-party code is one of the leading causes of poor LCP and INP. Heavy tracking scripts, chat widgets, and advertising pixels compete for the browser’s main thread. If these scripts load aggressively during the initial page load, they block the rendering of critical content and delay interactivity.
5. Is server-side caching enough to fix Largest Contentful Paint?
While server-side caching drastically improves Time to First Byte (TTFB), it only solves a fraction of the LCP equation. You must still optimize the frontend delivery of your LCP asset by preloading critical images, compressing media files, and eliminating render-blocking CSS and JavaScript that prevent the browser from painting the screen.
6. Do Core Web Vitals metrics matter for websites that require a user login?
Yes, primarily for user retention and conversion. While pages hidden behind a login wall cannot be crawled by Googlebot (and therefore do not impact your organic SEO rankings directly), poor Web Vitals on internal application pages will frustrate your active user base, leading to higher churn rates and negative brand perception.
7. Can a Content Delivery Network (CDN) fix layout shifts?
No, a CDN cannot fix Cumulative Layout Shift (CLS). A CDN improves the speed at which your assets are delivered to the user by serving them from geographically closer edge servers. CLS is purely a structural and styling issue caused by missing dimension attributes in HTML or unreserved space in CSS.
8. Why does my PageSpeed Insights score fluctuate throughout the day?
PageSpeed Insights lab data runs a real-time simulation over the network. Minor fluctuations in score (usually a few points) are entirely normal and are caused by varying server response times, minor internet routing delays, or third-party ad networks injecting slightly different payloads during the specific moment the test was run.
Keep reading
All articles
Creating SEO-Friendly URLs: The Complete 2026 Guide to Rankings, Clicks, and AI Citations
Every time you publish a page, you make a decision that follows it for years: you choose its URL. Most site owners…
Read article
The Ultimate Guide to Keyword Stuffing in SEO: Risks, Penalties, and Modern Alternatives
Search engine optimization constantly evolves, but certain outdated tactics stubbornly refuse to disappear. Decades ago, webmasters manipulated search rankings by packing web…
Read article
The Ultimate Guide to the Top Mobile App Development Platforms in 2026
Businesses across the globe recognize the undeniable power of mobile applications. A well-designed mobile app connects you directly with your target audience,…
Read article